

“Why is this cost so high?”
Ever heard this from your CFO before? Pretty sure we all have. And after your blood pressure levels out and your heart rate returns to normal, we often realize it’s a pretty fair question to ask. Especially for companies who are hyper-focused on cost reduction. Which, isn’t that all of us?
The effort to save money on business operations and processes is an ongoing obstacle. And when you’re talking background checks, it’s often an area that becomes a set-it-and-forget-it process. But that’s a surefire way to increase your costs.
So, what’s the solution? After working with and listening to our customers, it was clear. More transparency in the numbers.
After all, we’re the company that’s helping you run fewer background checks. So, why not show you how we do it? We’re thrilled to share we’ve built a robust and transparent Trust & Safety Dashboard for Yardstik customers. A background screening dashboard that actually works.
Introducing the one and only Trust & Safety Dashboard by Yardstik
Ok, so what is it exactly?
Think of metrics like cost-per-hire, conversion rate, and summary by state. We’re giving you the good stuff other companies might not want you to know.
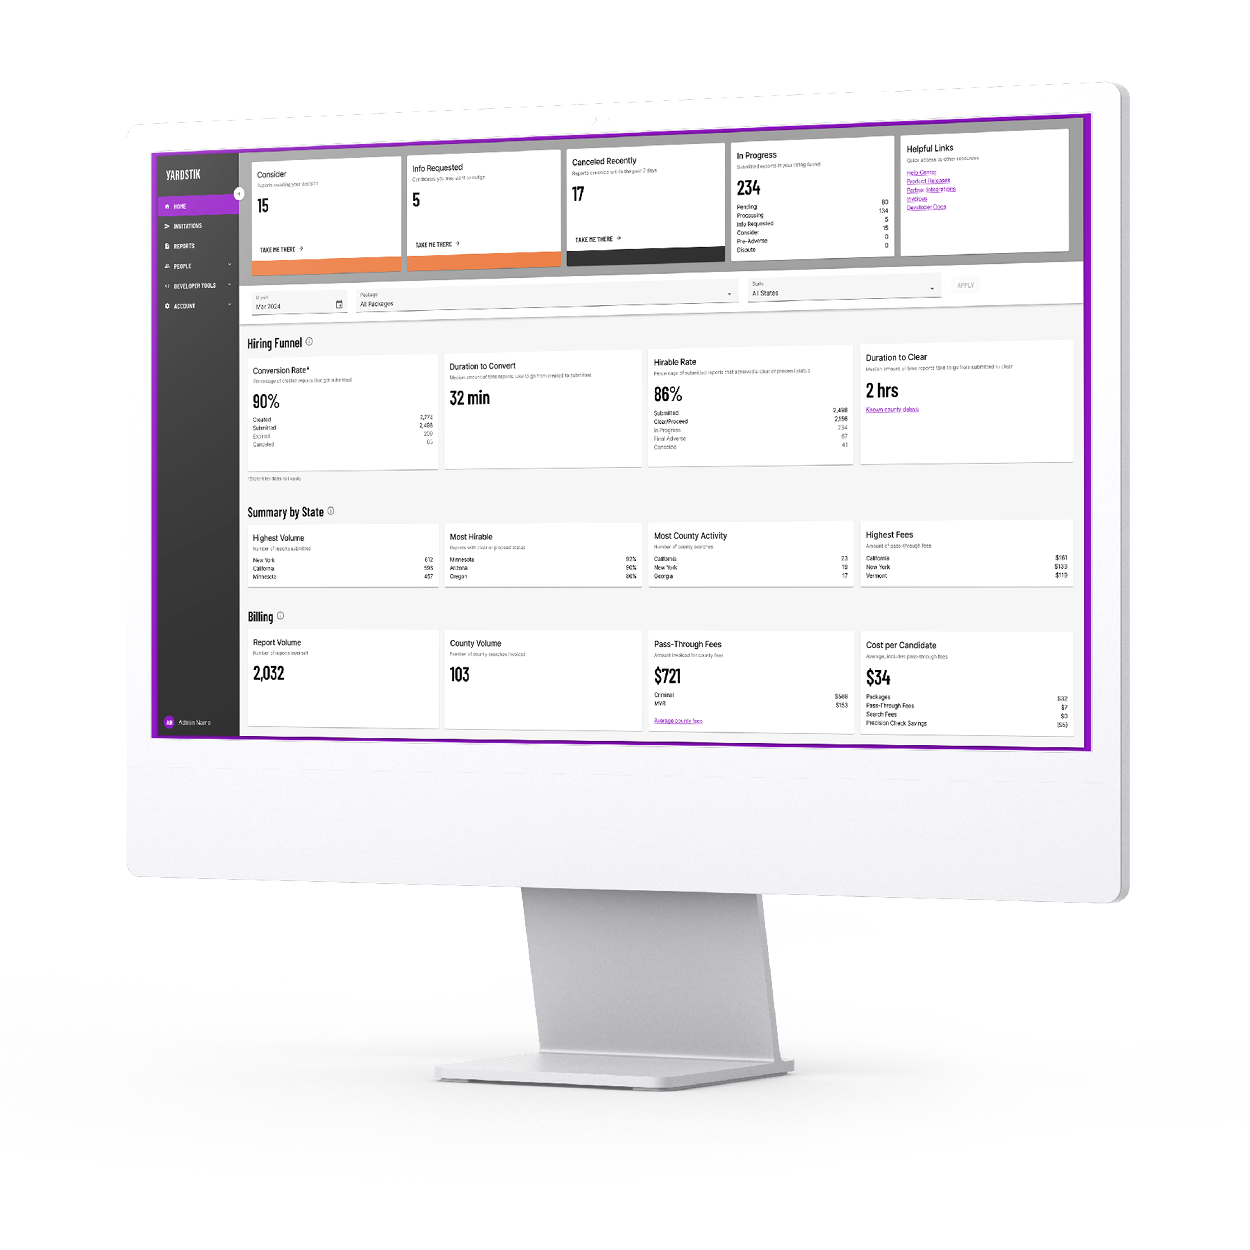
It’s a comprehensive background screening dashboard, showing you the metrics you need, right in the Yardstik platform. Yes, we have all of the necessary data points like report status, pass-through fees, and county delays. But we take it a step further and give you data that helps your teams make strategic decisions and save time and money.
So why are we sharing all of this? Besides being committed to being your trusted and transparent partner, we care about our customers and want to help them and their teams:
- Make proactive strategic decisions: The metrics we share tell a story that connects the dots. Your teams can evaluate costs and identify gaps in the process to make changes that optimize your revenue path. We’ve done the work to aggregate the important data points and give you the numbers that matter to your bottom line.
- Generally have easier lives: Is it possible? We think so. By having metrics that are visually straightforward, all in one place, and compelling for leadership, the dashboard makes the process seamless for users to use and provide updates to their leadership.
Making an impact across the team
This background screening dashboard isn’t only for the person who manages your background check process. It’s for them, your Director of Operations, and the CFO or COO.
We learned from our customers all of the ways they needed to use this data – for what purposes and what audiences. Here’s how each member of the team can best use this tool:
OPerations Manager / hr manager / office administrator
You’re running the day-to-day operations of the background check process, making sure you can move candidates through the process properly, seamlessly, and, of course, quickly. You care about the statuses of all reports, which need attention or action, and what the average duration to clear is. The dashboard is built so you can see this all in one place and take steps directly from the tool. It also helps you better determine where and how to spend your time, so you’re being as effective as you can be.
director of operations / director of hr
Overseeing the background screening program is your job. Your team manages the day-to-day, but you need to make sure it’s an effective and efficient process. You may not be in the tool regularly, but you need to see the high-level metrics that clearly tell the story of the platform’s success against business goals. And be able to bring that story to your leadership team.
cfo / coo
When it comes to background screening, you need to know that it’s not a heavy cost and the team and tools can move candidates through the process at the best speed possible to elevate business growth. You want to know the average cost-per-hire and if or how costs are fluctuating.
“It’s been really valuable to be able to show our directors and leadership team the data we get from Yardstik, like conversion rate. Just being able to see that the money we are spending for background checks is actually going to converted hires and onboarded candidates is big. The same is true for hirable rate. I can see in Yardstik that our hirable rate has been really high, which indicates that our recruiting team is doing a good job of screening people out. Overall, it’s been really cool and I like to see the data just laid out nice and easy.”
– Zack Rothman, Talent Acquisition Specialist at Hungry
Metrics that matter
We mentioned it a couple of times, and not to toot our own horn, but “toot toot”. We have the table-stakes data points you need for your day-to-day management, but we also have the metrics that allow your teams to make strategic decisions about the program – helping decrease costs and improve efficiencies.
Let’s dive a little deeper into three of those key metrics, so you can see exactly how the dashboard helps make your background screening program more effective:
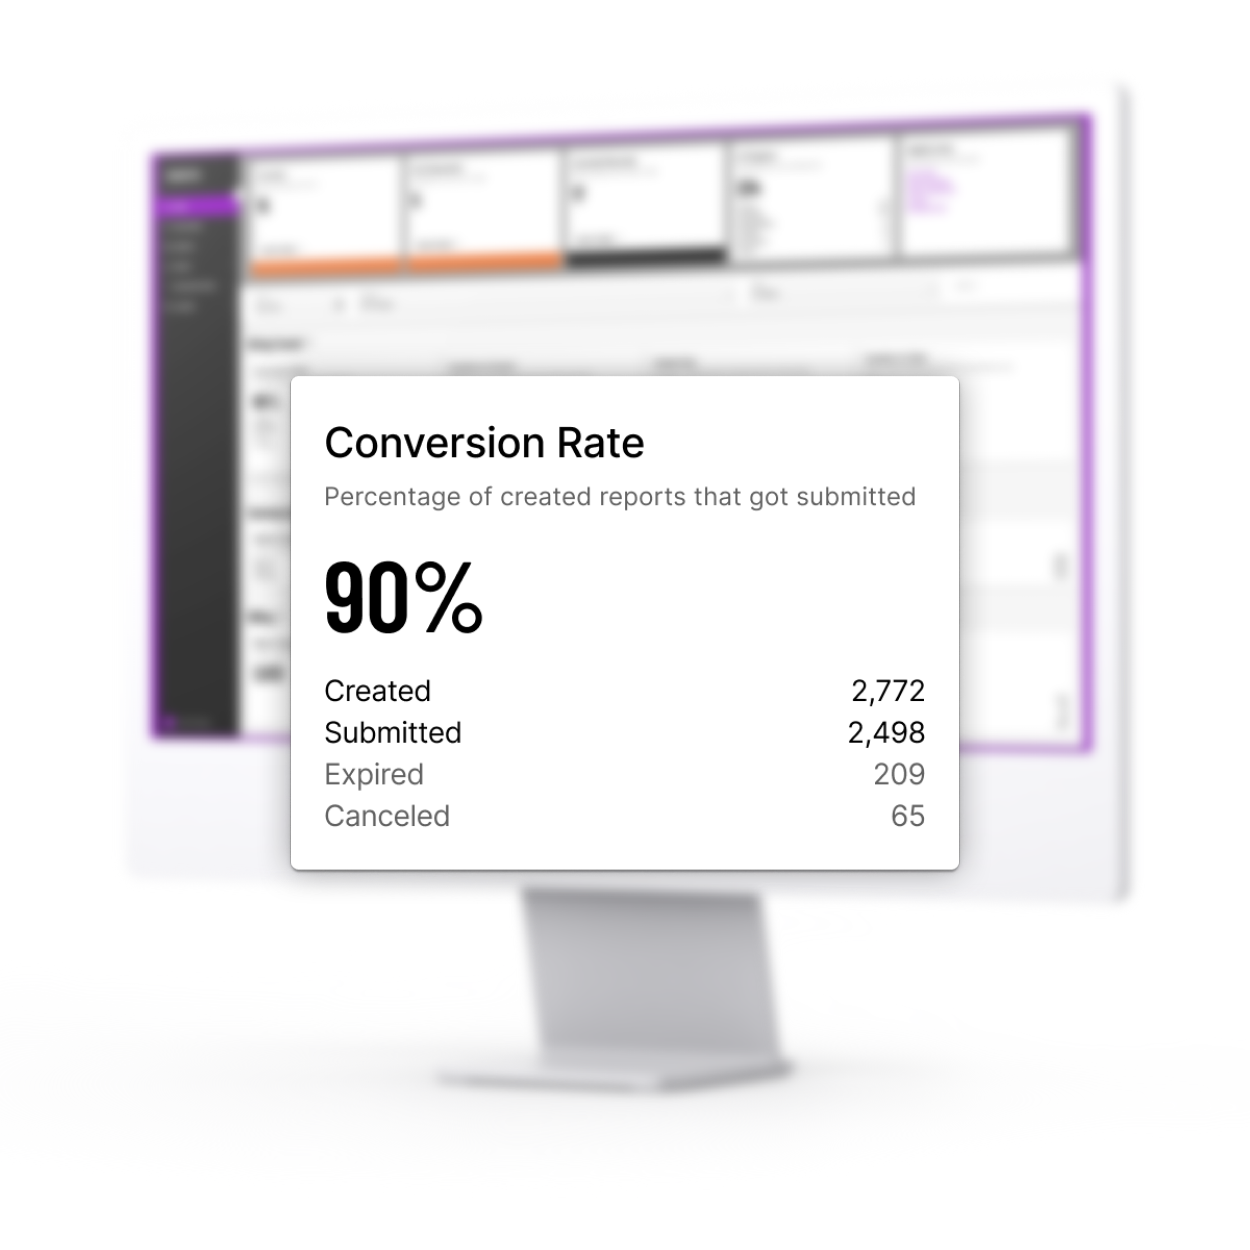
- Conversion rate: This is the percentage of created reports that were submitted and shows the rate at which you’re seeing conversion from your candidates. Essentially, it shows how successful you are at getting candidates to submit information. Additionally, this metric section highlights the totals of reports that have been created, submitted, expired, and canceled. A conversion rate percentage highlights the success of your program and is a good metric to track over time.
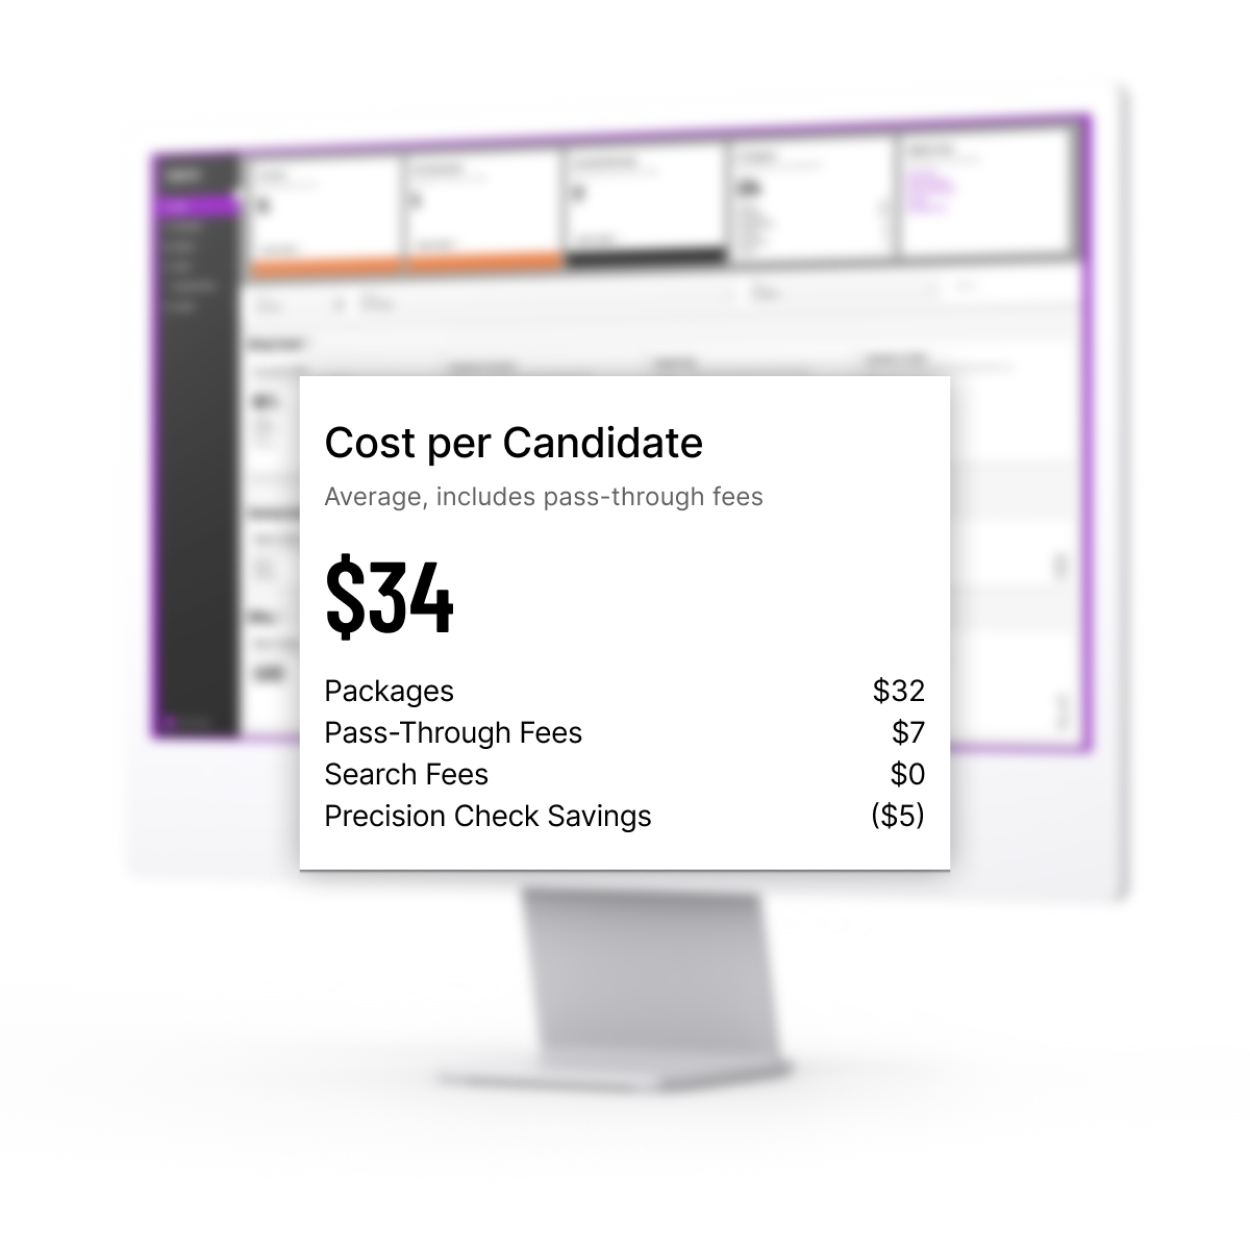
- Cost per candidate: This is the average cost per candidate submitted, in dollars, which includes all pass-through fees. Compiled from various data points, this shows how much money you spend on background screening by hire or candidate. In addition to showing you reports invoiced, county searches invoiced, and county pass-through fees, this lets you know the investment you make with each hire/candidate and if there is an opportunity to reduce costs.
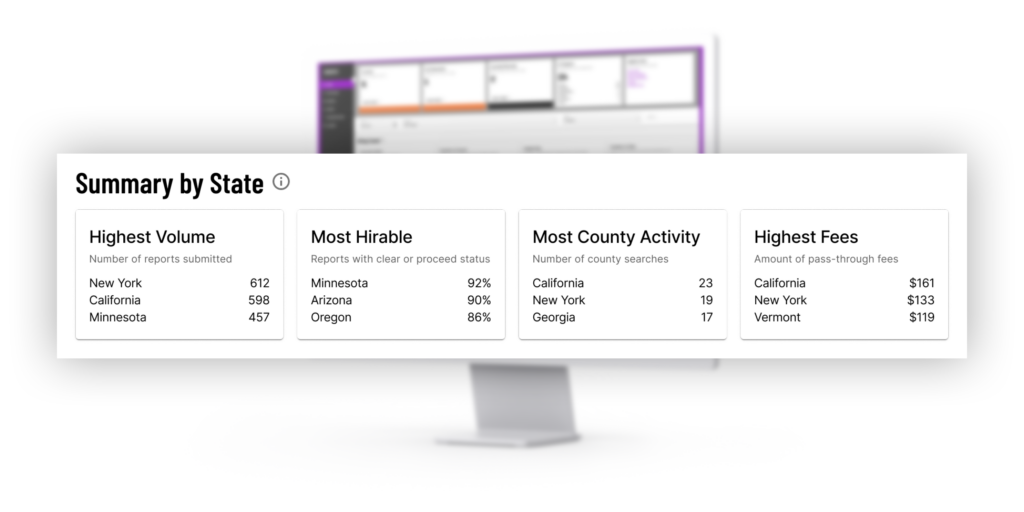
- Summary by state: This is a look at key metrics by state. This section of the dashboard shows you all of the following, by state, helping your team recognize key markets and locations that might be better fits.
- Report volume: Number of reports submitted
- Most hirable: Percentage of reports with clear or proceed status
- Most county activity: Total number of county searches
- Highest fees: Total pass-through fees, in dollars
Customer partnerships make us better
None of this would have been possible without the kick-a$$ (excuse our French) customers we have and we’re grateful for the open communication and trusted partnerships we have to continually improve our product.
So, instead of creating your run-of-the-mill table-stakes background screening dashboard (woof, apologies for the long phrase), our customers helped make sure this was a tool that’s meaningful and loved. And ultimately, makes a difference to the bottom line.
In case you’re not already moved by this article, hear from a few more customers about how it’s helped them:
“WOW! This is awesome and cool to see all our stats! 93% hireability rate is incredible!”
“Right when I log in to Yardstik, I can see the reports in progress, reports I need to review, and our hirable rate. To be able to see all these stats immediately available is awesome!”
“This is exactly what I’ve been looking for!”
Let’s connect
Want to learn more or see a demo? Reach out and we’ll connect you with one of our awesome reps to get the conversation started.